
Post-2015 Consensus: Poverty Assessment, Gibson
Assessment Paper
Summary of targets from the paper
| Target | Benefit for every dollar spent |
Rating |
|---|---|---|
| Eliminate extreme poverty. | $5 | GOOD |
| Cover x% of people who are poor and vulnerable with social protection systems. | <$1 | POOR |
| Build resilience of the poor and reduce by x% deaths and economic losses related to disasters. | <$1 | POOR |
| Ensure equality of economic opportunity for all women and men, including secure rights to own land, property and other productive assets and access to financial services for all women and men. | Varies by sector | UNCERTAIN |
| Achieve full and productive employment for all, including women and young people. | <$1 | POOR |
| Every country will monitor the wellbeing of its citizenry with improved measurements and reporting of life satisfaction. |
<$1 | POOR |
Introduction
How much does poverty cost? It is an easy question to ask but a surprisingly hard one to answer. Of the typical ways to measure poverty, only the poverty gap statistic – the average proportionate shortfall from the poverty line – can be interpreted in monetary terms. Assuming an all-knowing government making cost-free, perfectly targeted transfers to close poverty gaps, other researchers have calculated a global poverty gap of $82 billion at a $1.25 a day level of living. But this measure of the total cost of poverty ignores broader impacts on education, life expectancy etc. Also, transfers are neither perfect nor costless and effectively represents a 100% marginal tax rate for every dollar of extra income earned by the very poor.
In modern times, there has been a shift from accepting poverty as inevitable to believing that a minimum acceptable standard of living should be available to all members of society. Many people consider that poverty reduction is human development, and as such it is not something to be traded off against progress on other targets. Such a motivation to reduce poverty means no monetary value is ascribed to it, posing a severe challenge to an initiative like the Copenhagen Consensus. The most important poverty-related target in the Millennium Development Goals was to reduce extreme poverty ($1 a day in terms of the PPP dollar at the time). Most of the other proposals being made as part of the post-2015 agenda did not make the cut for the MDGs and, in the absence of compelling evidence, it is unclear why the situation should be any different now.
The most sensible option is to continue to monitor extreme poverty, knowing that the progress in reducing poverty made between 1990 and 2010 is unlikely to be repeated and that a zero goal by 2030 is improbable and likely distracts from more urgent tasks of doing a better job of consistently monitoring the poverty reduction that does actually occur.
The targets considered
Open Working Group targets
Relevant targets proposed are:
- eradicate extreme poverty by 2030 by bringing the number of people living on less than $1.25 a day (in 2005 PPP terms) to zero
- reduce the proportion of people living below national poverty lines by 2030
- by 2030 implement nationally appropriate social protection measures, including floors, with a focus on coverage of the most marginalized
- build resilience of the poor and reduce by x% deaths and economic losses related to disasters
- achieve full and productive employment for all, including women and young people
- ensure equality of economic opportunity for all women and men, including secure rights to own land, property and other productive assets and access to financial services for all women and men
High Level Panel targets
Four targets were suggested under the “ending poverty” goal:
- Bring the number of people living on less than $1.25 a day to zero and reduce by x% the share of people living below their country’s 2015 national poverty line
- Increase by x% the share of women and men, communities and businesses with secure rights to land, property, and other assets
- Cover x% of people who are poor and vulnerable with social protection systems
- Build resilience and reduce deaths from natural disasters by x%
There is a large degree of correspondence between these two sets of targets, and we will cover them under the headings of poverty, social protection, disaster resilience, economic rights and full employment below.
Proposals of idiosyncratic interest
A number of people, including Jeffrey Sachs and the Stiglitz Commission set up by then President Sarkozy, have proposed that measurements of wellbeing or life satisfaction be adopted to shift the emphasis away from purely economic progress. A case has also been made for using the Multidimensional Poverty Index (MPI). Both are flawed, but will be discussed further below.
A note on perspective
The perspective taken here is that of someone who is involved in designing, implementing and analysing surveys for measuring poverty at country level, in countries that vary widely in the success they have had to date in reducing poverty and in their capacity to undertake basic socio-economic measurement and analysis. From this point of view, many of the proposals made under the guise of the post-2015 agenda appear to be unhinged from the reality of statistical measurement in poor countries.
Too many proposals show unwarranted confidence in existing data sources and the abilities of governments and the UN to deliver even basic statistical measurements and reporting. A case in point is the failure of the UN to publish a Handbook on Poverty Statistics, which has remained in draft form for the last nine years, following a process begun in 1997, despite clear evidence of the need to improve data quality via harmonized methodology.
Background and context
Why reducing extreme poverty remains a hard target to achieve
The first, and most prominent, Millennium Development Goal is to eradicate extreme poverty and hunger. The first target under this goal is to halve, between 1990 and 2015, the proportion of people whose income is less than $1 a day. In fact, though the target is an income level, progress is measured mostly via consumption data. Also, the benchmark has now been reset to $1.25 a day. The point is that this is an evolving target, which was not formed de novo for the MDGs and reflects a set of contradictory influences.
Some researchers advocate different targets going forward, citing the fact that extreme poverty seems to have been halved five years ahead of target (47% of people in developing countries lived below the poverty line in 1990, but this had fallen to 22% by 2010). Since 700 million people have escaped extreme poverty, the argument is that a further billion would join them by 2027 if the historically fast growth in living standards continued. In fact, there are four factors which make such rapid progress unlikely in future.
First, the one-off institutional reforms in East Asia are unlikely to be replicated elsewhere. In 1987, the poverty rates of sub-Saharan Africa, South Asia and East Asia were all essentially the same. At that time, 48% of the poor lived in East Asia and the Pacific, including China, and 15% in sub-Saharan Africa. Highly unequal progress meant that, by 2008, the poverty rate in East Asia was just 14% while in Sub-Saharan Africa it was still 48%. Many East Asian countries can be described as highly capable states, whose history has included periods of misguided policy such as collective farming in China. Poverty reduction will be harder outside East Asia because it is easier for highly capable states to stop doing the wrong thing than for weak states to start doing the plethora of things needed for real improvement. This matters to global progress since poverty is increasingly concentrated in these less capable states; by 2008, 22% of the global poor were in EAP while 30% were in SSA.
The second factor is the role of rice in East Asia, where it is a more important food for the poor than in South Asia, and much more important than in sub-Saharan Africa. What is special about rice as a food for the poor is its negative income elasticity and different long-run price trend than the other two major staples, maize and wheat. As people escape poverty, they quickly switch from rice to products such as bread, dairy and meat but, since rice is rarely used as an animal feed, this does not raise indirect demand. On the other hand, demand for other grains is raised considerably as people consume more animal products. A further (tragically misguided) pressure on prices comes from biofuels policy. Outside East Asia, rising staple food prices may trap people below a rising poverty line.
Thirdly, as mass poverty is reduced, so the poverty rate becomes more sensitive to inequality and less sensitive to growth. In Vietnam, for example, the headcount rate for $1 a day poverty fell from 64% in 1993 to about 5% in 2010. At the previous, high, poverty rates, the elasticity with respect to inequality was just over half the elasticity with respect to growth; as the poverty rate fell, the inequality elasticity rose to almost three times that of the growth elasticity. In 2002, a growth of 1.6% per annum was enough to reduce the poverty rate by 1%, but by 2010 the same cut in poverty needed 6% growth. The difficulty posed for policy makers by the changing sensitivity of poverty is that reducing inequality so as to cut poverty may create zero-sum distributional conflicts while economic growth can be presented as a positive-sum outcome. The difficulty for practitioners is that surveys are doing a poor job of measuring the true level of and trend in inequality, especially in real terms where analysis is hampered by lack of data on spatial price differences. The most active debates are about measures of mean performance but it is measurement of inequality that over time becomes much more important for monitoring poverty.
Lastly, with the escape from mass poverty the poor increasingly begin to differ from the mainstream and therefore also from the decision-makers. In particular, the poor may live in different (often isolated) places, speak a different language, practice a different religion, or come from a different caste or ethnic group. For example, in India, the poverty rate of scheduled castes and tribes was 32% above the overall poverty rate in 1983, but this had risen to 44% above average by 2009/10. This compositional change makes a target of getting to zero poverty likely to be harder to attain than it was to transition from a society of mass poverty to one of low poverty.
We know less than we think about poverty
The evidence from global poverty counts is that Sub-Saharan Africa is the region that has done worst in reducing poverty . This region also has some of the weakest statistics, not only in household survey coverage but also in price data which is needed for consistent comparisons over time and space. More widely, the design of surveys is increasingly ill-suited to measuring poverty in a more affluent and more urban world. In particular, existing surveys fail to capture the rising share of meals eaten out of the home and also tell us little about consumption of housing, whose high income elasticity makes it of growing importance.
One response to measurement difficulties is to promote alternative, subjective, indicators such as measuring happiness. This is a mistake. Goals of maximizing either happiness or life satisfaction do not rest on firm welfare economic foundations. Moreover, the standard survey measures of these subjective variables are not suitable for cross-country, cross-group or over time comparison unless rather strong and unlikely assumptions are made. Such indicators can also be used to support policies that perversely reduce welfare and increase poverty, such as restrictions on human mobility (since some surveys suggest that migrants are less happy).
Other researchers promote the use of social protection transfers, but there are a number of unintended consequences. For example, results from Colombia suggest that subsidized health insurance can be a substantial disincentive to formal employment. Also, in more isolated rural areas, such transfers can push up wage rates and the cost of imported goods, so eroding real incomes for those who are not targeted. Finally, the response of richer members of society may be to opt out of their existing informal support of the poor, since these people are now being supported via tax revenues, so the ultimate beneficiaries are not the poor people who were targeted.
Methods of valuing benefits of reduced poverty
There are few existing benefit-cost ratios available from the literature. Two potential methods of valuing the benefits are considered here.
Consumption insurance effects
For anyone whose mean consumption is below the extreme poverty line, lifting their mean to the poverty line is valuable to them, but this also provides value to the non-poor, in the form of insurance benefits. The basis of this calculation is that uncertainty reduces the utility of anyone who is risk averse, and so they would be willing to give up some fraction of their actual, fluctuating income, to have a lower mean income with certainty. A study in India suggests that households would be willing to give up 16% of their total income in order to have a certainty income. Calculated benefits would rely heavily on the degree of risk aversion.
Mortality and human capital effects
Poor people live shorter, less economically productive lives, so the cost of poverty can be estimated from the change in the value of a country’s human capital stock. Such estimates of human capital are increasingly made by statistics offices; for example, 16 OECD countries have the stock of human capital worth five times the value of produced capital and 8-16 times the value of GDP. This approach has also been applied to the very long run history of Britain. British conditions in the 18th Century were considerably worse than those in today’s developing countries, so there is no reason why the same approach should not be applied to developing countries. As an exemplar, this approach is applied to a single developing country, Vietnam, with good data and remarkable progress in poverty reduction. Whether is growth or poverty reduction which drives the rising value of human capital is an open question, but most likely income growth triggers poverty reduction. It is likely that poverty kills more people than inequality, and the effect of poverty on mortality appears to be large.
Cost-benefit evaluation of proposed targets
Five targets are considered below. Only one of these – poverty – was included in the MDGs, so this will be the main focus. It is logical to assume that this still offers the best returns to investment and, despite the very high benefit-cost ratios claimed for other targets considered in the Copenhagen Consensus exercise, the presumption should be made that the optimal set of interventions is already being made.
Poverty
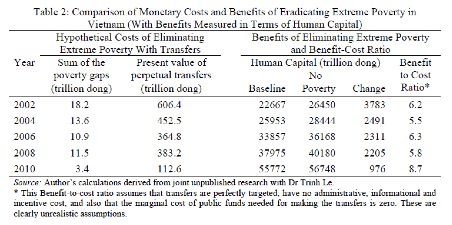
The estimated benefits of poverty reduction are based on calculated aggregate human capital for Vietnam over 2002-2012. It takes a great leap of faith to extrapolate from this one case to elsewhere. Young, well-educated, non-poor, males are worth over 3.5 billion dong (US$170,000) in the labor market (over a working lifetime) while young, poor, unqualified, males are worth less than 1 billion dong. Over the decade from 2002, human capital in Vietnam rose from 22,667 trillion dong to 63,049 trillion dong, an increase equivalent to approximately $2 trillion at market exchange rates. Poverty reduction accounted for 8.1% of this growth.
Simulating the change of human capital over the same period on the assumption that extreme poverty was eradicated gives a human capital value of 26,450 trillion dong in 2002, rising to 63,883 trillion in 2012. The gap between the baseline and ‘no poverty’ scenarios gets proportionally smaller with time. In 2002, eradicating extreme poverty would have raised the aggregate value of human capital in Vietnam by 16.7%. In contrast, by 2012 the elimination of extreme poverty would raise the value of human capital by just 1.3%. Faster growth doesn’t appear to have diminishing returns; if the assumed rate of growth is 6% per annum rather than 5%, the value of human capital would be 18% higher. Although the effect of growth on poverty becomes smaller as poverty falls, turning away from growth (perhaps by emphasizing redistribution) could do considerable damage to the value of human capital.
In the absence of data from the literature on actual costs of achieving a given poverty reduction, some simple estimates can be made. The sum of poverty gaps could be considered as a lower bound to the cost of implementing one way to eliminate extreme poverty, by means of perfectly targeted transfers. The costs and benefits of closing all poverty gaps in the case of Vietnam are summarised in the table, suggesting that benefit-cost ratios would be in the range 6-9.
However, there are other considerations. First, transfers are not costless. Taking account of administrative costs and the deadweight losses of taxes, the present value of the cost of perpetual transfers should be raised by at least 50%, bring BCRs down to the range 4-6. Second, Vietnam has one of the best records for economic growth and poverty reduction, and most other countries are likely to be less successful. On balance, it seems that the target of eliminating extreme poverty should be placed squarely in the “Fair” category, noting the uncertainty of extrapolating from a single case study.
Social protection
Social protection targets have been suggested by both the HLP and OWG, despite the various drawbacks mentioned above. New technology allows better targeting of individuals, but there are still doubt that improved transfers will have the required effect. Despite concerns about ‘poverty traps’ – that poverty begets poverty – evidence for them is weak. Also, a randomized trial of large subsidies found no effects on children’s schooling outcomes or their subsequent criminal activity or health, suggesting that there are factors other than income at play and raising doubt about evidence based on observational studies. While conditional cash transfers (CCTs) are currently very popular, conditionality may perpetuate the circumstances the transfers are designed to overcome, by giving people an incentive to continue in their present state. Lastly, social protection programs may create long-term fiscal obligations that may harm future economic growth, and countries should carefully consider the future tax implications of funding these programs.
Taking all of these considerations into account, the best that can be said about the social protection target is that the ratio of benefits to costs remains uncertain. If this target had to be consigned to a particular evaluation category, it would most likely be “Poor” given the many unintended consequences that may result.
Disaster resilience
Adopting a target to reduce deaths and economic losses due to disasters would likely lead to over-investment in disaster mitigation activities, at the cost of under-investment in other risk reducing activities. Wasteful over-investment in reducing loss from a particular risk provides a lower return than if the money was spent in other ways, and so lowers incomes. At lower incomes, people engage in more risky activities. Therefore, in general, undertaking an inefficiently excessive risk reduction effort may, paradoxically, increase the expected number of deaths through this income pathway. This post-2015 target should therefore be considered as “Poor”.
Economic rights
Proposed targets include property and other economic rights, with a special focus on equalizing rights for men and women. While there is certainly evidence of a gender bias in agriculture, it is unclear if inequalities in access to productive inputs (including finance) cause the same inefficiencies in other sectors. Although agricultural productivity can increase by giving women equal access to resources, grants made to owners of microenterprises increased income for men but not for women. Capital alone seems not to be enough. These sectoral differences are an important consideration as agriculture declines in importance with development. For this and other reasons, the best categorization for this target is “Uncertain”.
Full employment
Full employment is a complex target, since the commonly accepted metric of the non-accelerating inflation rate of unemployment (NAIRU) is intrinsically variable with time and economic circumstances. In addition, it is likely that such a target would be used by some policymakers and interest groups to argue for greater employment protection provisions, which are economically costly and often end up hurting the very workers they are designed to protect. As such, this proposed target falls into the “Poor” category.
Conclusions
Of the various proposed targets, the only one that is likely to have a promising benefit-cost ratio is reducing extreme poverty. Many of the proposals made in the context of the post-2015 agenda appear to be unhinged from the reality of statistical measurement in poor countries. The proposals also appear to come from a position of cheerful ignorance about how little is known about many aspects of poverty and about the unintended consequences from the diverse ways that people may respond to interventions that are motivated by some of these proposed goals and targets.